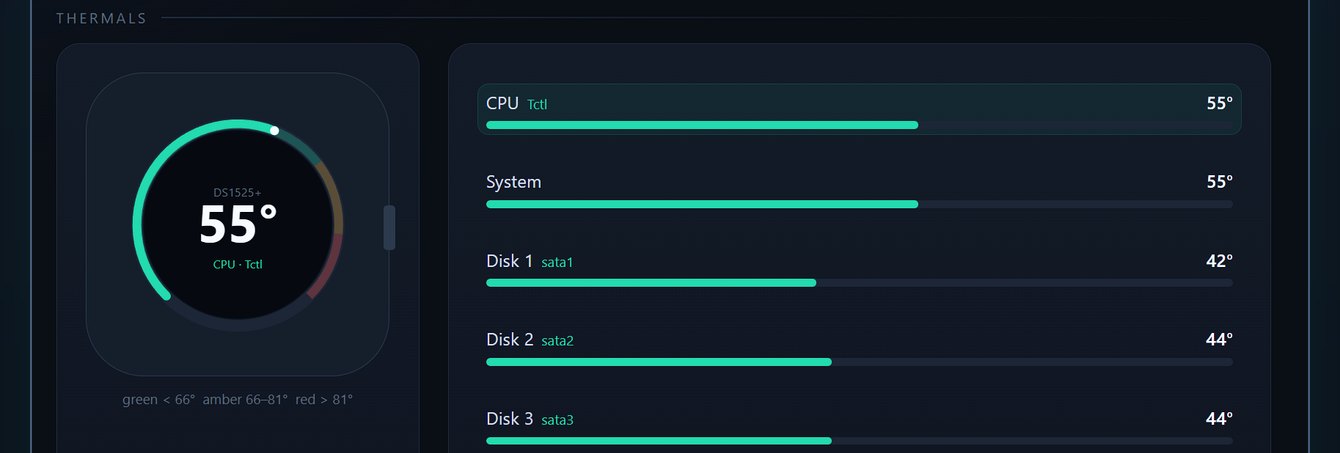
Getting temperatures off an AMD-based Synology NAS is a maze of half-working paths. Glances in Docker reads the CPU but can't see the board temperature, the bundled smartctl is too old for JSON output and needs the -d sat trick, and AMD CPUs report as Tctl / k10temp rather than the labels most tutorials copy.
nas-monitoring picks the right source for each value, merges them into one tidy JSON endpoint and cross-checks every reading — built for an ESP32 / M5Dial desk display, and readable by anything that speaks HTTP.
What you get
- CPU from Glances (AMD
Tctl), the system board from Synology's ownsynowebapi— the value DSM shows — and every disk fromsmartctl(SMART attribute 194). - Verified, not vibes —
verify.pyre-reads each value through a different path (raw sysfs, synowebapi, DSM Storage Manager) and compares. - Set and forget — a small collector daemon keeps the JSON fresh, and the web layer comes back on its own after a reboot.
- A live dashboard served from the same nginx root, colouring each reading by zone and flagging a stale feed.
- Light — shell, Python 3 and two small containers; no database, no agent.
The endpoints are unauthenticated and LAN-only by design, so they should stay inside your network. The same one-JSON contract is meant to grow into a physical desk dial for the whole NAS. MIT-licensed.